Without an SEO roadmap strategy, your digital presence would loom out of sight and land onto page two, three, or four of Google search results – which according to some experts are the best places to hide a dead body and evade a murder. A poor ranking is what it takes from going out of sight to being out of business. You have invested so much effort in building a glitch-proof website with quality content, the next step is to kickstart your SEO marketing goals, and consequently rank on page one of Google results.
In order to do that, you essentially need to set an SEO roadmap – a documentation of all the SEO-related tasks you need to achieve in a given timeframe, in your given budget, and with your given resources. But before creating a full-fledged SEO roadmap plan, you first want to fully acquaint yourself with fundamental SEO tools to gain useful insights before and after implementing all your SEO efforts. One such tool is Google Analytics.
What is Google Analytics?
Curious to know what’s happening on your website? How users are coming and going, how they are interacting with your website, how long do they stay, where are they coming from, what prompts them to make a transaction? Google Analytics is the two-word answer. Google Analytics is a free web analytics tool amongst other key marketing products offered by Google. By familiarizing yourself with the data presented by the Google Analytics platform, what has already been achieved can be used to improve what needs to be achieved.
You can incorporate informed decisions in your SEO content strategy simply by reading the metrics shown by this product but oh-ho, how does Google analytics work? It’s fairly simple. The platform works by capturing a website/app’s data and then presenting it to you statistically in the form of tables, charts, and graphs. To be able to read this data, you need to understand the platform’s interface. Google Analytics homepage interface may be difficult to get hold of for beginners, but let’s make it easy for you by discussing only the top 5 features of it which you need to know for now.
Help your SEO roadmap strategy with the top 5 features of Google Analytics
Despite the gigantic number of marketing tools now made available, Google analytics has still been an absolute favourite of marketers. Why? Because it is free and gives you insights on more than 200 metrics that cover your marketing process. Following are a few top features of Google Analytics – some of the metrics that the platform lets you track for your website, which you can integrate with your in-house solutions to boost your rankings:
- The Reports menu found on the top left-hand side of the Google Analytics platform broadcasts the following details:
-
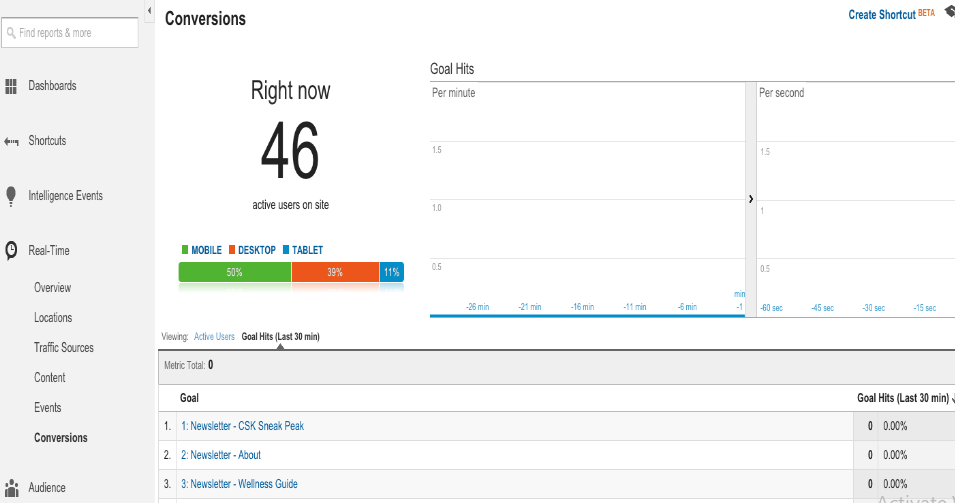
- Real-time – See how your visitors are interacting with your website in real-time, each second. Discover where exactly is your traffic coming from, what content is the traffic viewing the most, and much more. For example, you can check how many users are currently visiting your website, which pages they are interacting with, and which conversion goals have occurred.
- Audience – See the number of users who have visited your website in the past seven days (you can change the time frame as per your need), explore how traffic fluctuates over the days, the demographic breakdown of your users, and the devices they are using.
- Behavior – See how users are behaving once they land on your website. You can track every step of your users from entry to exit here while also tracking the average amount of time a user spends on your website, the percentage of visitors who leave the site without visiting other pages on the same site, and more.
- Conversion – See the specific actions that your visitors take to reach your goal (ask for price, make a transaction, etc.) while also telling you how much time the user spends at each of the steps.
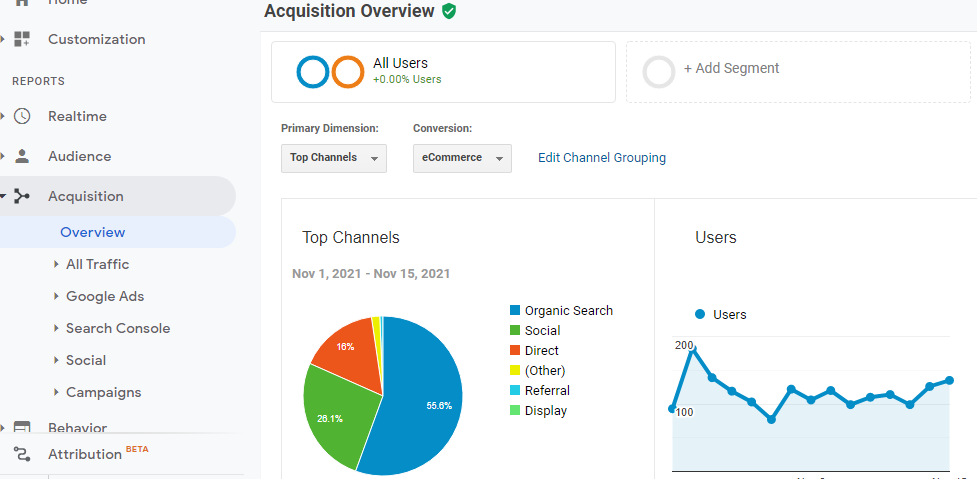
- Acquisition – See if the marketing plan you formulated in your SEO roadmap strategy has worked yet. Here, you can see a breakdown of where all your traffic is coming from (through referrals, social media, organic search on search engines, or by directly typing in your URL). If you are advertising on Google, acquisition reports will tell you which keywords are producing the best response.
…but your keywords do not have the potential to produce the kind of response you are expecting if you do not know how to use them appropriately. To reap the benefits of Acquisitory Google analytics, you must really know how and where to use the best keyword phrases. Let’s cover that briefly for you.
How do I Get My Website on Page 1 for Best Keyword Phrase?
The view from the top is pretty amazing, and that is where you ought to be. But how do you reach there – how do you rank higher than your competitors on Google? It’s simple, you use the best keyword phrase and outrank your competitor – Well, not that simple actually. But don’t worry, we are here with a list of these simple steps you can adopt to actually explode your rankings and have an unmatchable spike in your revenue. You can find more about these steps here. The next thing would be celebrating your success as you mark one more milestone on your SEO content strategy as complete. Now, assuming that you already have a strong website, let’s begin.
- Initial Keyword Research
- Competition Analysis
- Gauge intent, use long-tail keyword
- Optimize content while creating it
- Publish your content
- Promote your content
- Results analysis through Google Analytics Reports
Placement of your keyword is crucial when it comes to website ranking. The real task is to incorporate the keywords effortlessly so that they do not seem randomly stuffed. For every page on your site, there must only be one topic or target keyword phrase to focus on. So if you have 5 topics, you must divide them into 5 pages with 5 target keywords and put them in the following places to help google rank your site:
- Title Tag (Page Title)
- The body (the main part of the content)
- Header tags (H1, h2, H3, H4, H5, and H6)
- Formatted text (Bullet points or bold text)
- Website URL
- Folder or pathname (of sub-pages)
- Page name (most crucial place)
- Alt tags (of graphics/infographics)
How Google Analytics will Help in improving Your SEO

Google Analytics is the cult of analytics. Period. Having discovered it once and explored how it benefits your business, there is no going back. The SEO data it offers is legit and accurate and safe to say, priceless. Brands including Travelocity, Lenovo, PBS, Westwing have capitalized on the SEO insights offered by the Google Analytics platform to tweak their marketing roadmap plan, and consequently their marketing efficacy.
For example, if Analytics shows that most of the visitors on Lenovo’s website are coming from Facebook, then the marketers might want to concentrate their ads on Facebook. Or let’s assume Lenovo notices a high bounce rate on its page which features, perhaps, monitors for home (Lenovo popular). Then there is a possibility that the page needs to be optimized for mobile devices. Leave Lenovo for now, let us focus on your small-scale business for now. Here are 8 ways to improve your SEO with Google Analytics.
Track visitor demographics and interests
Has the marketing plan you formulated in your SEO roadmap strategy worked yet? Which marketing/promotional strategy has paid off? Where exactly is the traffic coming from? To help answer these questions, go to the Acquisition section » overview. Here you can see a breakdown of where all your traffic is coming from (through referrals, social media, organic search on search engines, or by directly typing in your URL). Equally important is to track the age, gender, interests, and more. To generate a statistical report of demographic data and interests of the users, go to your Google Analytics account, click property settings and enable demographic and interests reports from under the advertising feature. Save changes.
Analyze Landing Page Traffic
You can conduct a landing page analysis with the Google Analytics platform. Simply navigate to Behavior » site content » Landing pages. Here, you would be able to identify all your high-converting pages. Make sure to repromote these pages to increase conversions. The essential landing page metrics (bounce rate, time spent on page, users flow) shown by Google Analytics allow you to monitor your content closely. Is your content (copy, photos, form field, free content) performing up to the mark or does it need an upgrade? In case the content needs modification or optimization, then make sure to make only one modification at a time to your landing page. In this way, you would be able to test and improve your landing page thoroughly.

Google AMP tracking
Google’s Accelerated Mobile Pages (AMP) is an open-source initiative to offer a smooth browsing experience to users visiting your site on mobile. AMP pages load faster, yet are a stripped-down version of your original webpage. AMP pages have a lightning bolt symbol next to them when they show in Google results. How many of you are reading this article on your laptops? Just About 30% of the total readers while the rest of the readers are logged in from their mobiles. It’s where you read, make important purchase decisions, and make e-commerce transactions.
The good thing is that you can track the user interactions on your AMP if you have added Google Analytics tracking in your code – leave it to the experts! Once the code is ready, you can find the AMP data on Google Analytics by logging into your account and selecting the website for which you want to see the AMP data. Go to Behavior » Site Content » All Pages. In the search bar above the table which appears, type the keyword /amp. Traffic reports from your AMP pages will now show.
Install a Tracking Code on your Website
You need to install Google analytics on your website before learning how to use it. When you are done setting up your account, you will be presented with a unique tracking code that needs to be applied to your website. In order for Google Analytics to collect essential data from your pages, it needs to be installed on every page of your website. In case you do not have experience adding the code to the website, you might want to delegate the process of adding the code to a web design company. Having done that, you can leave it to Google to gather data about each user when they visit your website and later present it to you in the Google Analytics dashboard. This is how Google Analytics works.
Make an SEO dashboard
Google Analytics is a marketer’s best bet to track their SEO efforts, but it sure is not an easy tool to navigate. With so much already cluttering your plate, you might want to declutter Google analytics to only show the SEO data which truly matters to your business. The good news is, this is possible. By setting up an SEO dashboard, you can easily track your SEO analytics data without having to first sort it according to your preference. You will see the dashboard visually showing your SEO metrics and KPIs which you have set as soon as you open Google Analytics. A general SEO dashboard could include the following metrics:
- Total visits from SEO
- Non-branded visits from SEO (change filter to your brand name with variations)
- Top known keywords (same thing)
- Most viewed pages from SEO
- Traffic type
- Main search engines used
- All search engines used
- Cities finding the website through SEO + load times (use a CDN if slow)
Create SEO-related goals in Google Analytics
Goals are the actions that you want your visitors to take when they visit your website. You need to define your measurement plan to measure your goals – for Google to be able to show you the metrics which denote whether or not the goal has been achieved. You can define this measurement plan by setting up metrics that you want to track. These metrics could be the number of conversions, rate of conversion, most effective marketing campaign which is helping to convert, etc. To create a goal, navigate admin » goals » new goal.
Track visitor conversion rates
At the end of the day, conversions are what matters the most. All this hustle just to achieve one result: business growth. For this reason, there is more than one way to track your conversions on Google Analytics (whatever is convenient for you). Navigate to the audience » overview, and here you can have a look at your conversions along with the bounce rate, session time, and device type.
Track your Bounce Rate
A ‘bounce’ – also called a single-page, or single-engagement session – happens when a visitor lands on your webpage and leaves without going to another page. He does not interact with your page in any meaningful way (e.g. does not click on a link/product nor makes a transaction). While a high bounce rate does not directly impact your rankings, it affects other things which google very much factors in while ranking your webpage, like your web design, web speed, and mobile optimization. A higher bounce rate might indicate that one of the aforementioned is doing poorly, and needs upgrading. You can see user bounce rates under the audience » overview.
Conclusion & Summary
Every business has a blueprint to success – more like a blueprint to achieve their marketing goals which they have embedded in their SEO roadmap strategy. To cover small milestones on your strategy, Google Analytics is the best choice you could make for all the reasons discussed above. What we have just covered are just a measly number of ways you can benefit from Google Analytics, and more would be discussed in articles to come until you have completely, totally mastered the art of using the Google Analytics platform.